Interval Data: When You Need to Know More
Your monthly electric bill shows how much electricity you use each month, and how much you need to pay them. But what if you need a bit more detail, like how much you use each day or hour? Well, it turns out that they keep such data (it’s called interval data), and they are happy to share it with you at no charge. But they require you to ask for it.
Here is an example of how your interval data can be very useful.
The February Smart Energy article about onsite electric generation was popular with readers, and some asked about what is needed when seeking a proposal. Facilities will need to provide both electric cost and usage information to ensure potential solutions are the proper size and affordable.
Several copies of the electric bill provide the cost information. But usage information at an hourly level is also needed. A full year of usage data helps cover seasonal and cyclical variations. So, where does such data come from?
This is where interval data comes in.
A few foundries contacted their electric utility and requested interval data for their accounts. Each utility company determines the detail which is recorded and how much history is maintained in their interval data files for your account. As an example, some utilities provide your kWh consumption every 15 minutes, while others record it only every hour. Available history might be for a month, or it could be for a year or more.
The cost and usage data is then modeled to see what, if any, onsite generation solutions would be appropriate.
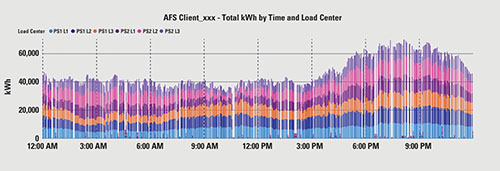
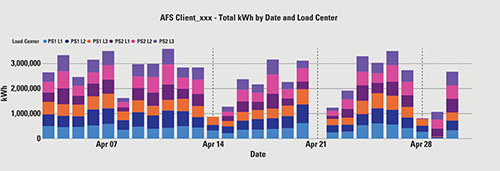
The following is an example of an analysis of combined electric consumption data collected from six different load centers (with their own meters), in a facility. A full month of interval data is included and summarized by time of day. The analysis helps properly configure onsite generation equipment (Fig. 1-2).
In the case depicted in Figure 2, significantly less electric consumption seems to occur on the weekends. This may affect how the onsite generation equipment is programmed to operate.
Other Uses
Knowing how much electricity you’re using at any given time can provide new perspectives into your business operations. Unusual spikes can be identified and investigated for cost-saving opportunities. Unexpected consumption can reveal situations where equipment is left on when it shouldn’t be running.
Interval data can be helpful in investigating other potential energy efficiency improvement opportunities. One example is to reduce the cost of the demand charge on your electric bill. The demand charge represents the “high water mark” of your electric use during the month.
Your demand charge is often 50% (or more) of your total electric bill. Having interval data can help identify when high demand is happening, enabling you to identify the source and possibly take corrective action. Such improvements can reduce every future electric bill.
Each electric utility company seems to have a different format for the interval data that they provide. In one case, hourly usage data was provided for each hour for every day of the prior year. The Excel spreadsheet they provided with the interval data had a column for each day, resulting in 366 columns. Thankfully, specialized software tools exist to ease the burden of reorienting the data to a more useable format.
Most people don’t know that the electric company keeps such detailed information about how much electricity you use and when you use it. But there are limitations. Just like your electric bill, the data represents the electricity that is recorded by the meter supplied by the electric company—the one that is typically outside the building. To understand how the electricity is used inside your building, additional data must be collected by using submeters. That is a topic for a future article in Smart Energy.
For more information on this column, contact the author at breinke@tdi-consulting.com .
Click here to view this article in the May 2020 digital edition.